>

Coronavirus Forecasting Dashboard

Welcome to our presentation of a predictive Corona Virus model. We provide insight of COVID-19 and attempt to forecast the number of cases that could arise in the future.

Overview

Coronavirus spread

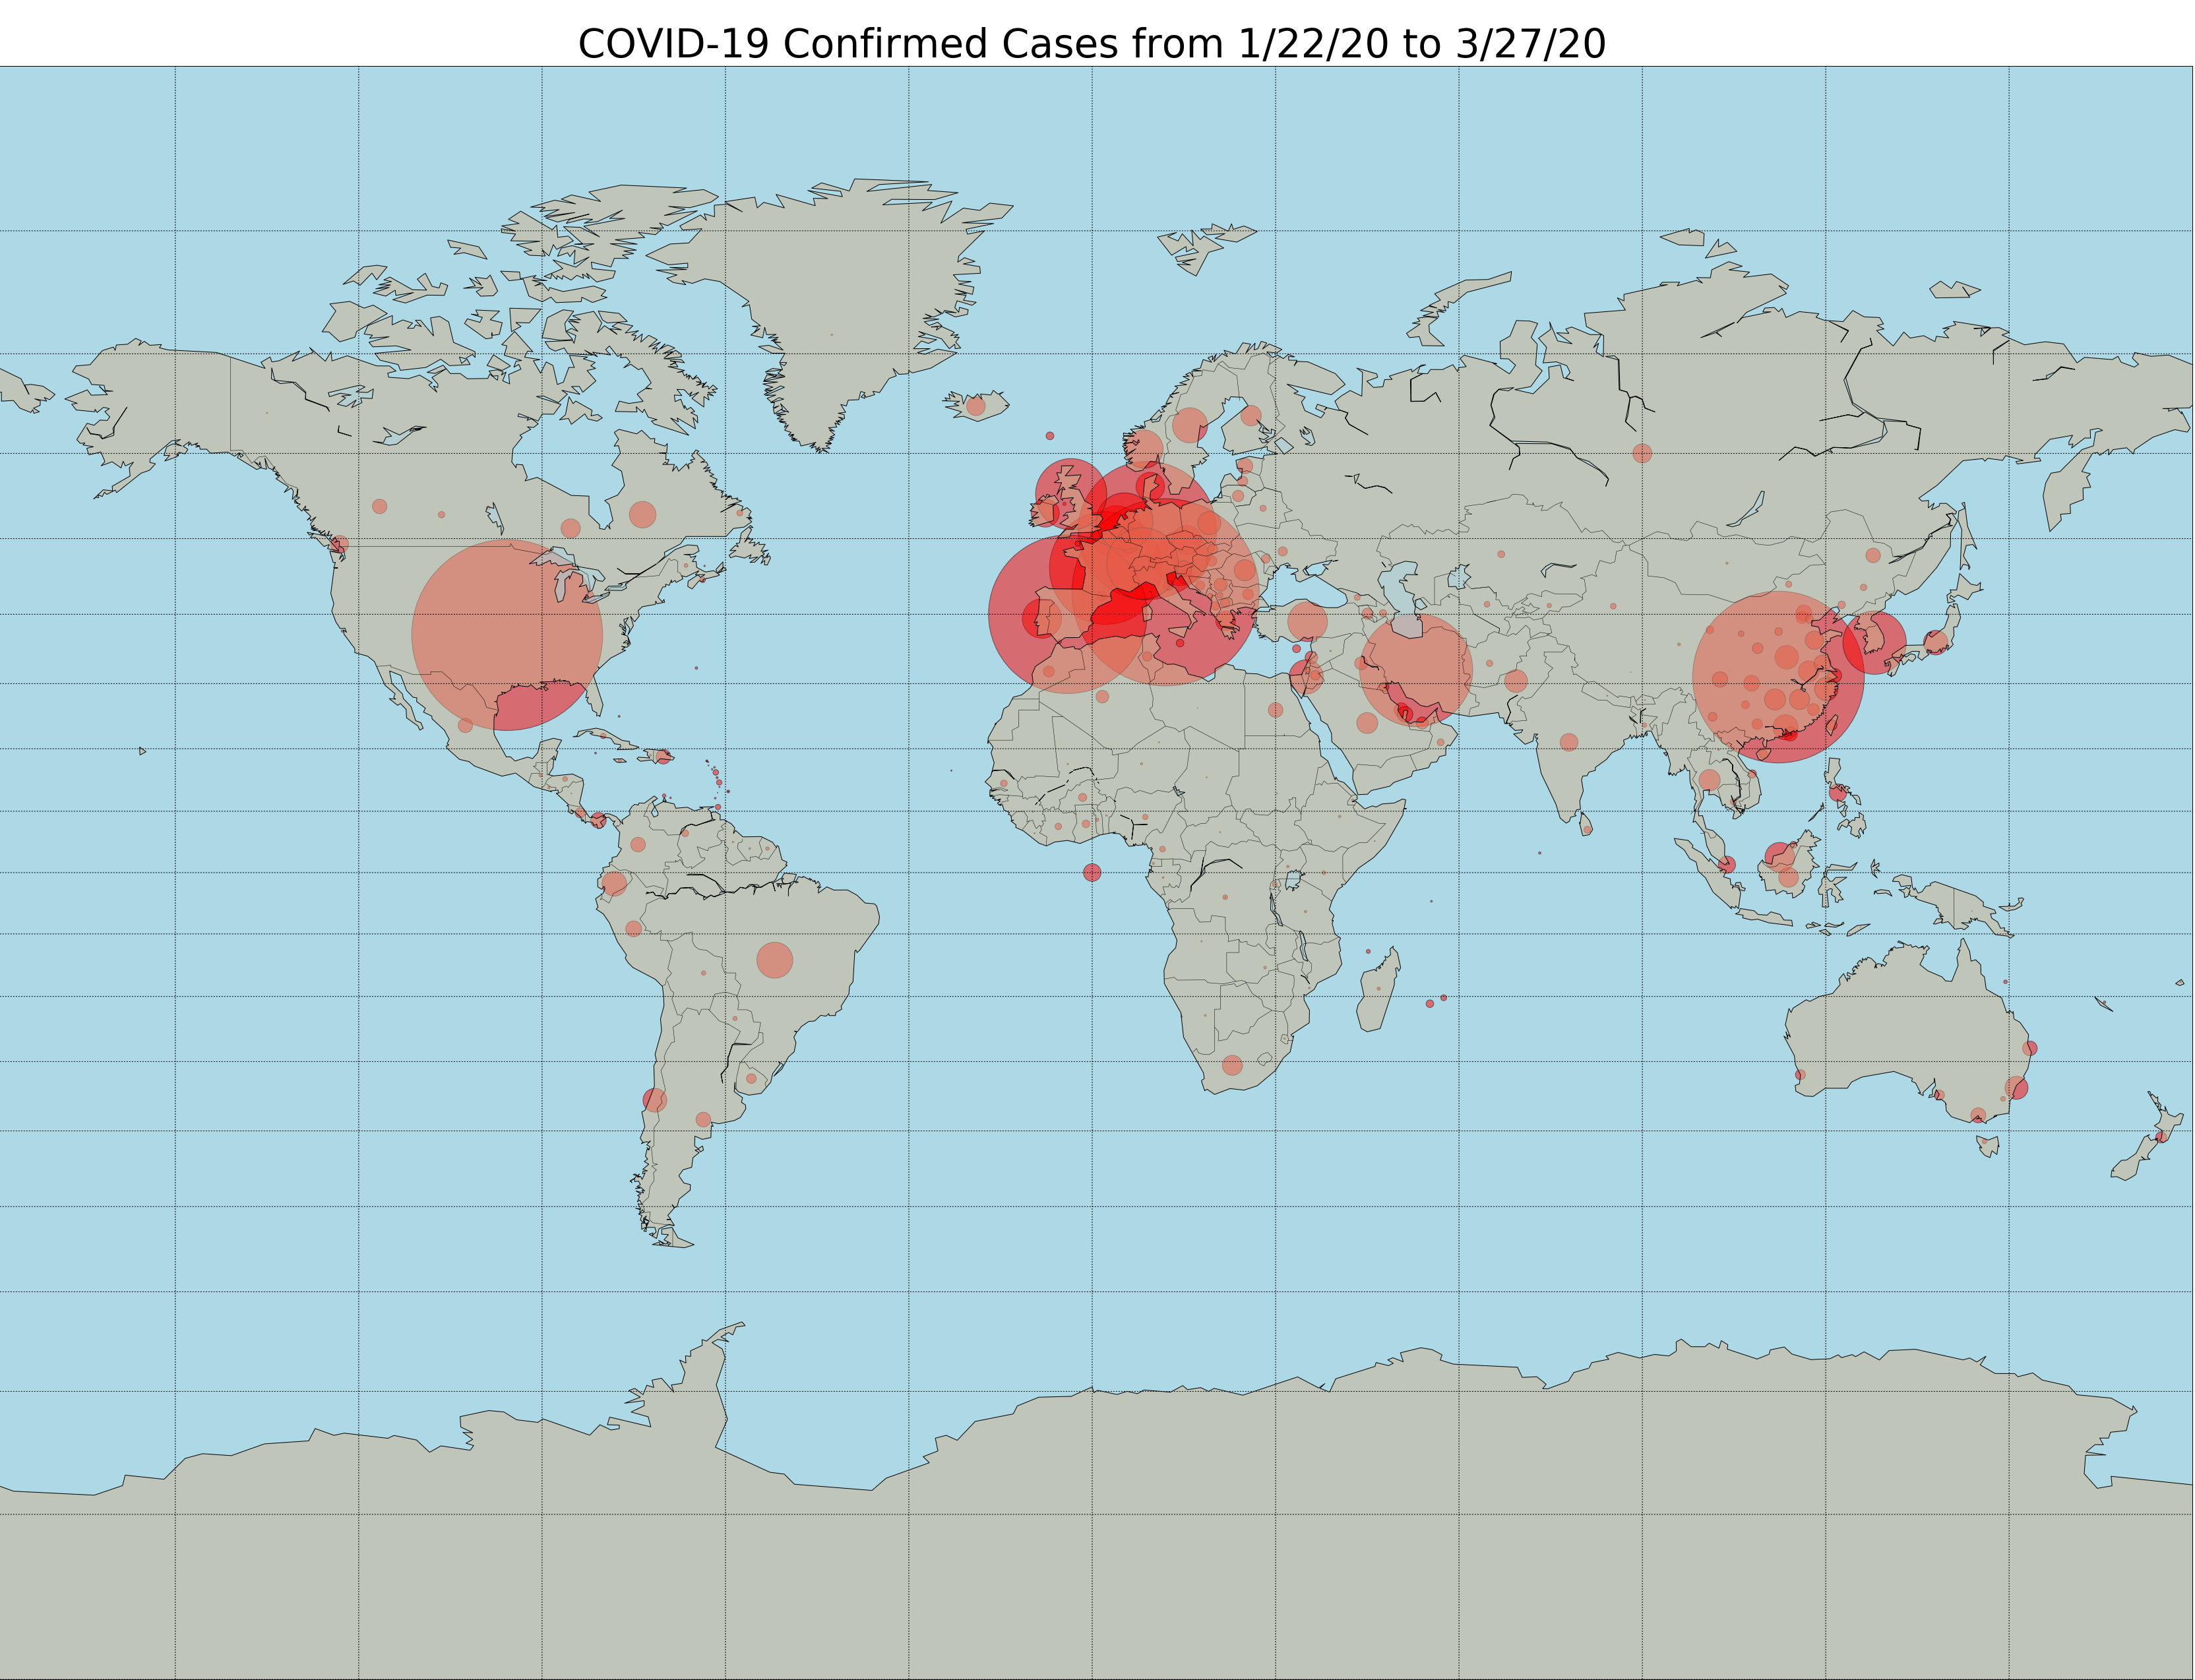
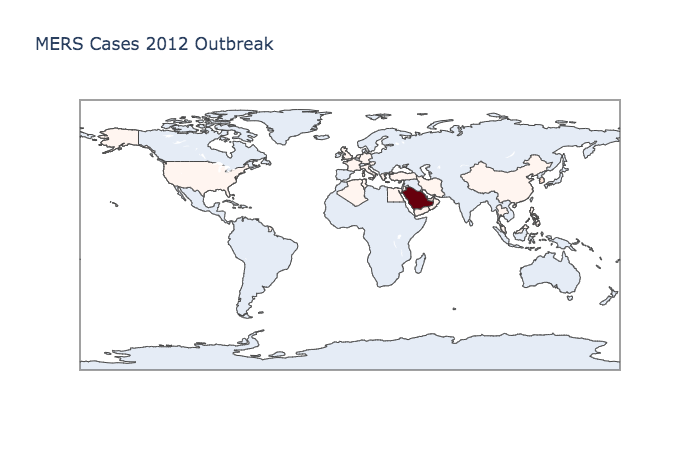
Visualization made using MatPlotLib's Basemap tool

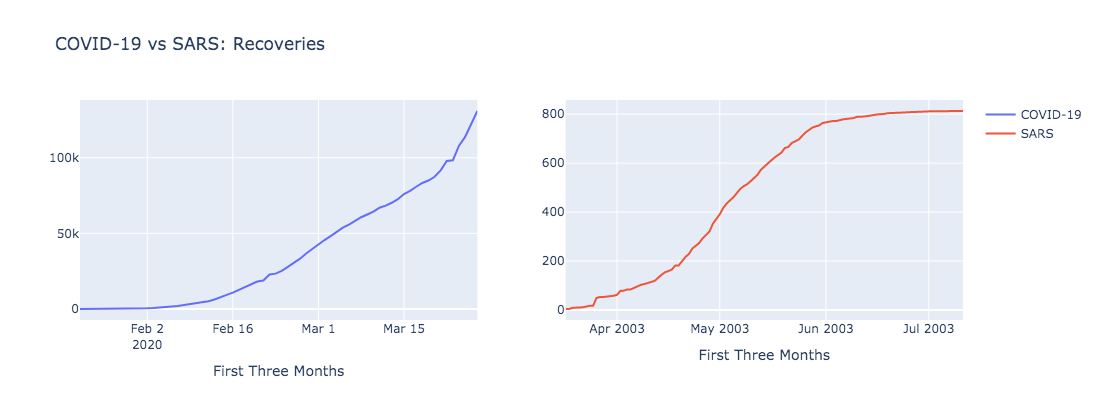
On March 11th, 2020, the World Heath Organization declared the CoronaVirus a pandemic. An estimated 114,000 peple contracted the virus in 114 various countries by then. As of March 29, 2020, Over 720,000 cases have been reported in 177 countries. The virus will not stop spreading anytime soon and current actions, especially in the United States, have been futile.

Coronavirus, more specifically COVID-19, is a respitory disease caused by a novel coronavirus. This specific coronavirus does not cause death to the majority of people with an estimated death rate between one to three percent. However, the Kaiser Family Foundation released a statistic stating that about 100 million of american adults are at risk for serious illness. Because of the virus's ability to spread through miniscule droplets, the threat is definitely a reality.

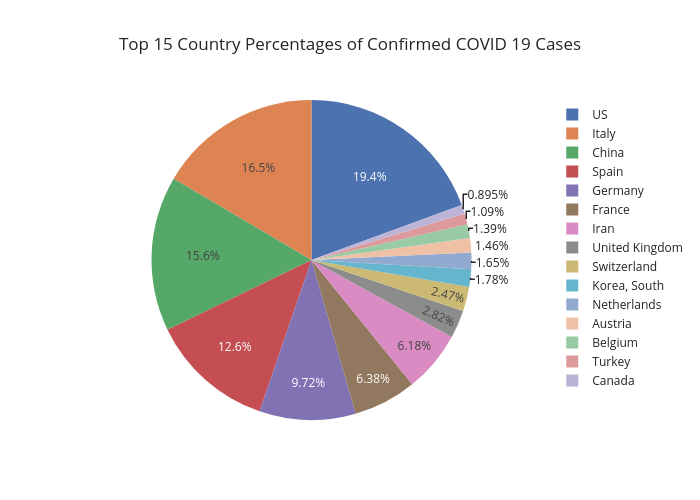
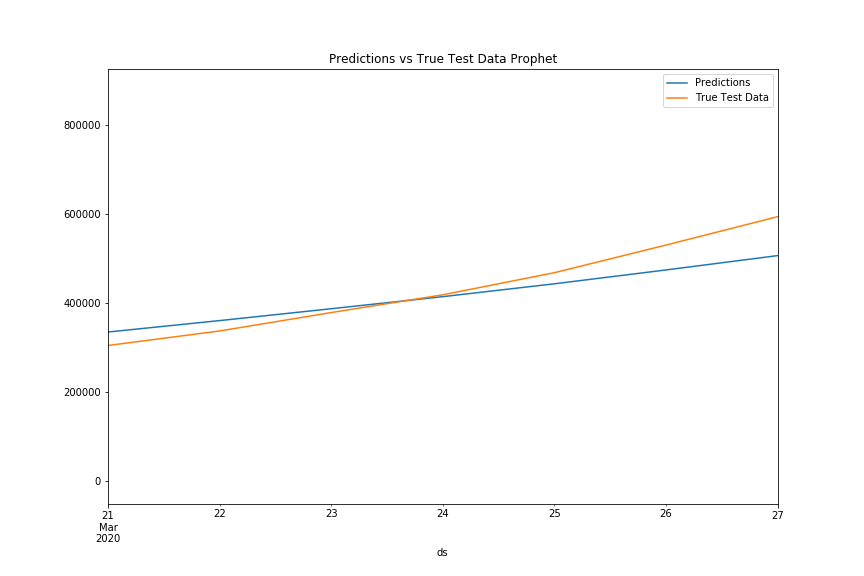
Based on current efforts, it seems that the virus is going to exponentially spread for at least the next few weeks. This can partially be illustrated by the pie chart below. What was once predominantly in China, is now most prominant in the United States. For this reason, we wanted to focus on predicting the sriousness of the situation and attempt to predict the amount of cases that can potentially arise. These efforts can benefit the government and Hospitals by approximating how many resources they will need.

Plot 2

Coronavirus country percentage

Comparison with Similar Diseases

Severe Acute Respiratory Syndrome (SARS) is a virus that was identified in 2003 that attacks the respiratory system. It affected 26 countries with over 8000 cases and 774 deaths. Most cases of human-to-human transmission occurred in the health care setting, in the absence of adequate infection control precautions. Implementation of appropriate infection control practices brought the global outbreak to an end.

Middle Eastern Respiratory Syndrome (MERS) is a virus that was identified in 2012 and has since spread to several other countries. It is a type of coronavirus that affects the respiratory system. MERS affected 27 countries with over 2400 cases and 858 deaths. Limited, non-sustained human-to-human transmission mainly in health care settings continues to occur. The risk of exported cases to other areas other than the Middle East remains significant.

The new coronavirus seems to be less deadly than SARS and MERS, which killed around 10% and 35% of people who became infected, respectively. The new coronavirus is structurally similar to SARS, with the two viruses sharing about 80 percent of their genomes.

Although COVID-19 hasn't had as much time to develop as SARS yet there are many similarities in the timeline of confirmed cases.The exponential growth of COVID-19 cases so far is similar to the first 3 months of SARS. The only difference is the amount of SARS cases plateaued and COVID-19 cases is still rising, most likely due to the fact that the scale of COVID-19 is much higher.

The exponential growth of the deaths due to COVID-19 so far is very similar to the growth of SARS deaths in the first 3 months of its life. The amount of SARS deaths, however, seems to have plateaued while the amount of COVID-19 cases is still growing due to the mass scale of the pandemic.

The growth of the of the amount of recoveries from COVID-19 is very similar to that of SARS in its first 3 months, but it is expected to continue growing. SARS plateaued because it was controlled at a significantly smaller size while the amount of COVID-19 cases is on a completely different scale.

MERS had an exponential growth in cases when it first appeared in 2012 and its growth in cases is very similar to that of SARS and COVID-19 but it is not comparable to either because of how widespread COVID-19 and SARS are compared to it. MERS is not a good disease to compare COVID-19 to because it was predominant in mainly Saudi Arabia and wasn't nearly as widespread as SARS. The similar qualities between SARS and COVID-19 made these two diseases better to compare.

Machine Learning Models

The following models were used to predict the amount cases that could arise from the virus:

Recurrent Neural Networks (RNN)

1. Utilized a Recurrent Neural Network and trained the model with RNN first and then built an LSTM. Developed neural network to train on first 6 days of week and predict on the 7th day of the week as we only had 66 days of data.

2. Utilized cross validation to account for smaller dataset, modeled validation loss vs loss.

3. After testing the data we compared our model predictions to the actual results and both were similar in projections.

4. After testing the data we compared our model predictions to the actual results and both were similar in projections.

You can access the RNN models by clicking on this message!

Exponential Regression

We built off of OLS regression and developed an exponential regression model. Pandemics in their first stage tend to have exponential growth, thus our model traced the test data very well, however in regards to future forecasts, it may not be able to accurately predict the growth as the model remains exponential and may not be able to account for any changes in the world in regards to COVID-19. Despite this, the model performed extremely well in regards to tracking the first few months of COVID and could be used with many other pandemics in their initial stages.

You can access the regression models by clicking on this message!

Facebook's Prophet Library

The Prophet Library was pretty accurate in regards to comparing the prediction values to the real-time data points. Overall, the Prophet Library seemed to predict a much more linear type progression of COVID rather than the exponential one we have been noting.

We forecasted into April and similar to the RNN predicted nearly 850,000 cases within the first week of COVID19.

After our forecasting, we attempted to note the point of greatest change in trend in the data using the features of the Prophet Library.

You can access the Prophet models by clicking on this message!